Electrocardiogram (ECG) use, components, types, what problems can an electrocardiogram detect?
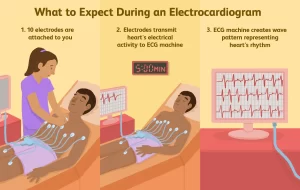
An electrocardiogram (ECG) is a record of the electrical changes (depolarization and repolarization) that occurs in the heart to get a complete picture of the electrical activity of the various parts of the heart, the electrodes are placed on different positions of the body.
Electrocardiogram (ECG)
The Electrocardiogram (ECG or EKG) can record the heart‘s electrical activity over time, It is used to assess the heart‘s rhythm and detect any abnormalities. It’s a non-invasive, quick, and essential tool for diagnosing a range of heart conditions. These electrodes are used to record the electrical changes occurring in the heart, and are formed of 12 leads:
- Group 1:bipolar leads (I,II,III).
- Group 2: augmented limb leads (aVR, aVL, aVF).
- Group 3: chest leads (V1, V2, V3, V4, V5, V6).
How ECG Works
The electrodes of ECG are placed on the skin, typically on the chest, arms, and legs, These electrodes can detect the electrical signals generated by the heart, The signals are recorded and displayed as a waveform on a monitor or printed on paper, The waveform represents the different phases of the heart‘s electrical cycle, including atrial and ventricular contractions.
Components of an ECG Wave
- The p wave represents the atrial depolarization (contraction of the atria).
- QRS complex represents ventricular depolarization (contraction of the ventricles), The QRS complex is the most prominent part of the ECG.
- T wave represents the ventricular repolarization (recovery of the ventricles before the next contraction).
- The PR interval is the time between the start of the P wave and the start of the QRS complex, representing the electrical conduction from the atria to the ventricles.
- ST segment is the flat line following the QRS complex, representing the period when the ventricles are depolarized.
Uses of an ECG
- Diagnosing arrhythmias (abnormal heart rhythms).
- Detecting myocardial infarction (heart attack).
- Monitoring heart conditions like hypertrophy (thickening of the heart muscle) or ischemia (reduced blood flow).
- Assessing pacemaker function.
Types of ECGs
- A resting ECG is taken while the patient is at rest.
- Exercise ECG (Stress Test): Taken while the patient exercises to observe heart function under stress.
- Holter Monitor: A portable ECG worn for 24-48 hours to capture continuous heart activity.
View of the heart
The arrangement of the leads produces the following anatomical relationships:
- Leads I,aVL,V5,V6 view the lateral surface of the heart.
- Leads II,III, AVF view the inferior surface of the heart.
- Leads VI.V2, view the septal surface of the heart.
- Leads V3,V4 view the anterior surface of the heart.
For example: if there are any abnormalities in the ECG in V5 lead that means that the problem is in the lateral surface of the heart and so on.
Normal ECG record
- P wave: represents atrial depolarization.
- QRS complex: reflects the depolarization of the ventricles.
- T wave represents the repolarization) of the ventricles.
- PR interval: it reflects the time of electrical impulse takes to travel from the SA node through the AV node.
- ST segment.
- QT interval.
Abnormalities
pericarditis
- There is ST elevation in all leads.
- Treated by: NSAIDs and colchicine.
atrial fibrillation
- Irregularity with the absence of p-wave.
- ECG tracing of a normal heart rhythm.
In atrial fibrillation, the tracing shows tiny. irregular “fibrillation” waves between heartbeats. The rhythm is irregular and erratic.
sinus tachycardia
Irregularity with the presence of the p wave may be due to anemia.
hyperkalemia
Hyperacute T wave in all leads.
mvocardial infarction
- Recent anterior MI (Hyperacute T :MI /V3,V4 :anterior).
- Inferior STEMI: ST elevation in II,II,aVF.
- Lateral ischemic changes on lateral view (ST depression in I,aVL,V5,V6).
You can follow science online on YouTube from this link: Science online
You can download Science Online application on Google Play from this link: Science online Apps on Google Play
Electrocardiogram (ECG) importance, ECG test results, analysis and abnormalities
Cardiac muscle properties, Conduction system of the heart, Cardiac excitability and contractility
Properties of cardiac muscles, Cardiac automaticity & Conduction of electrical impulses
Histology of the heart, Cardiomyocyte types, Ultrastructure & features of cardiac muscle fibers
Heart & Pericardium structure, Abnormalities & Development of the heart
Heart function, structure, Valves, Borders, Chambers & Surfaces


